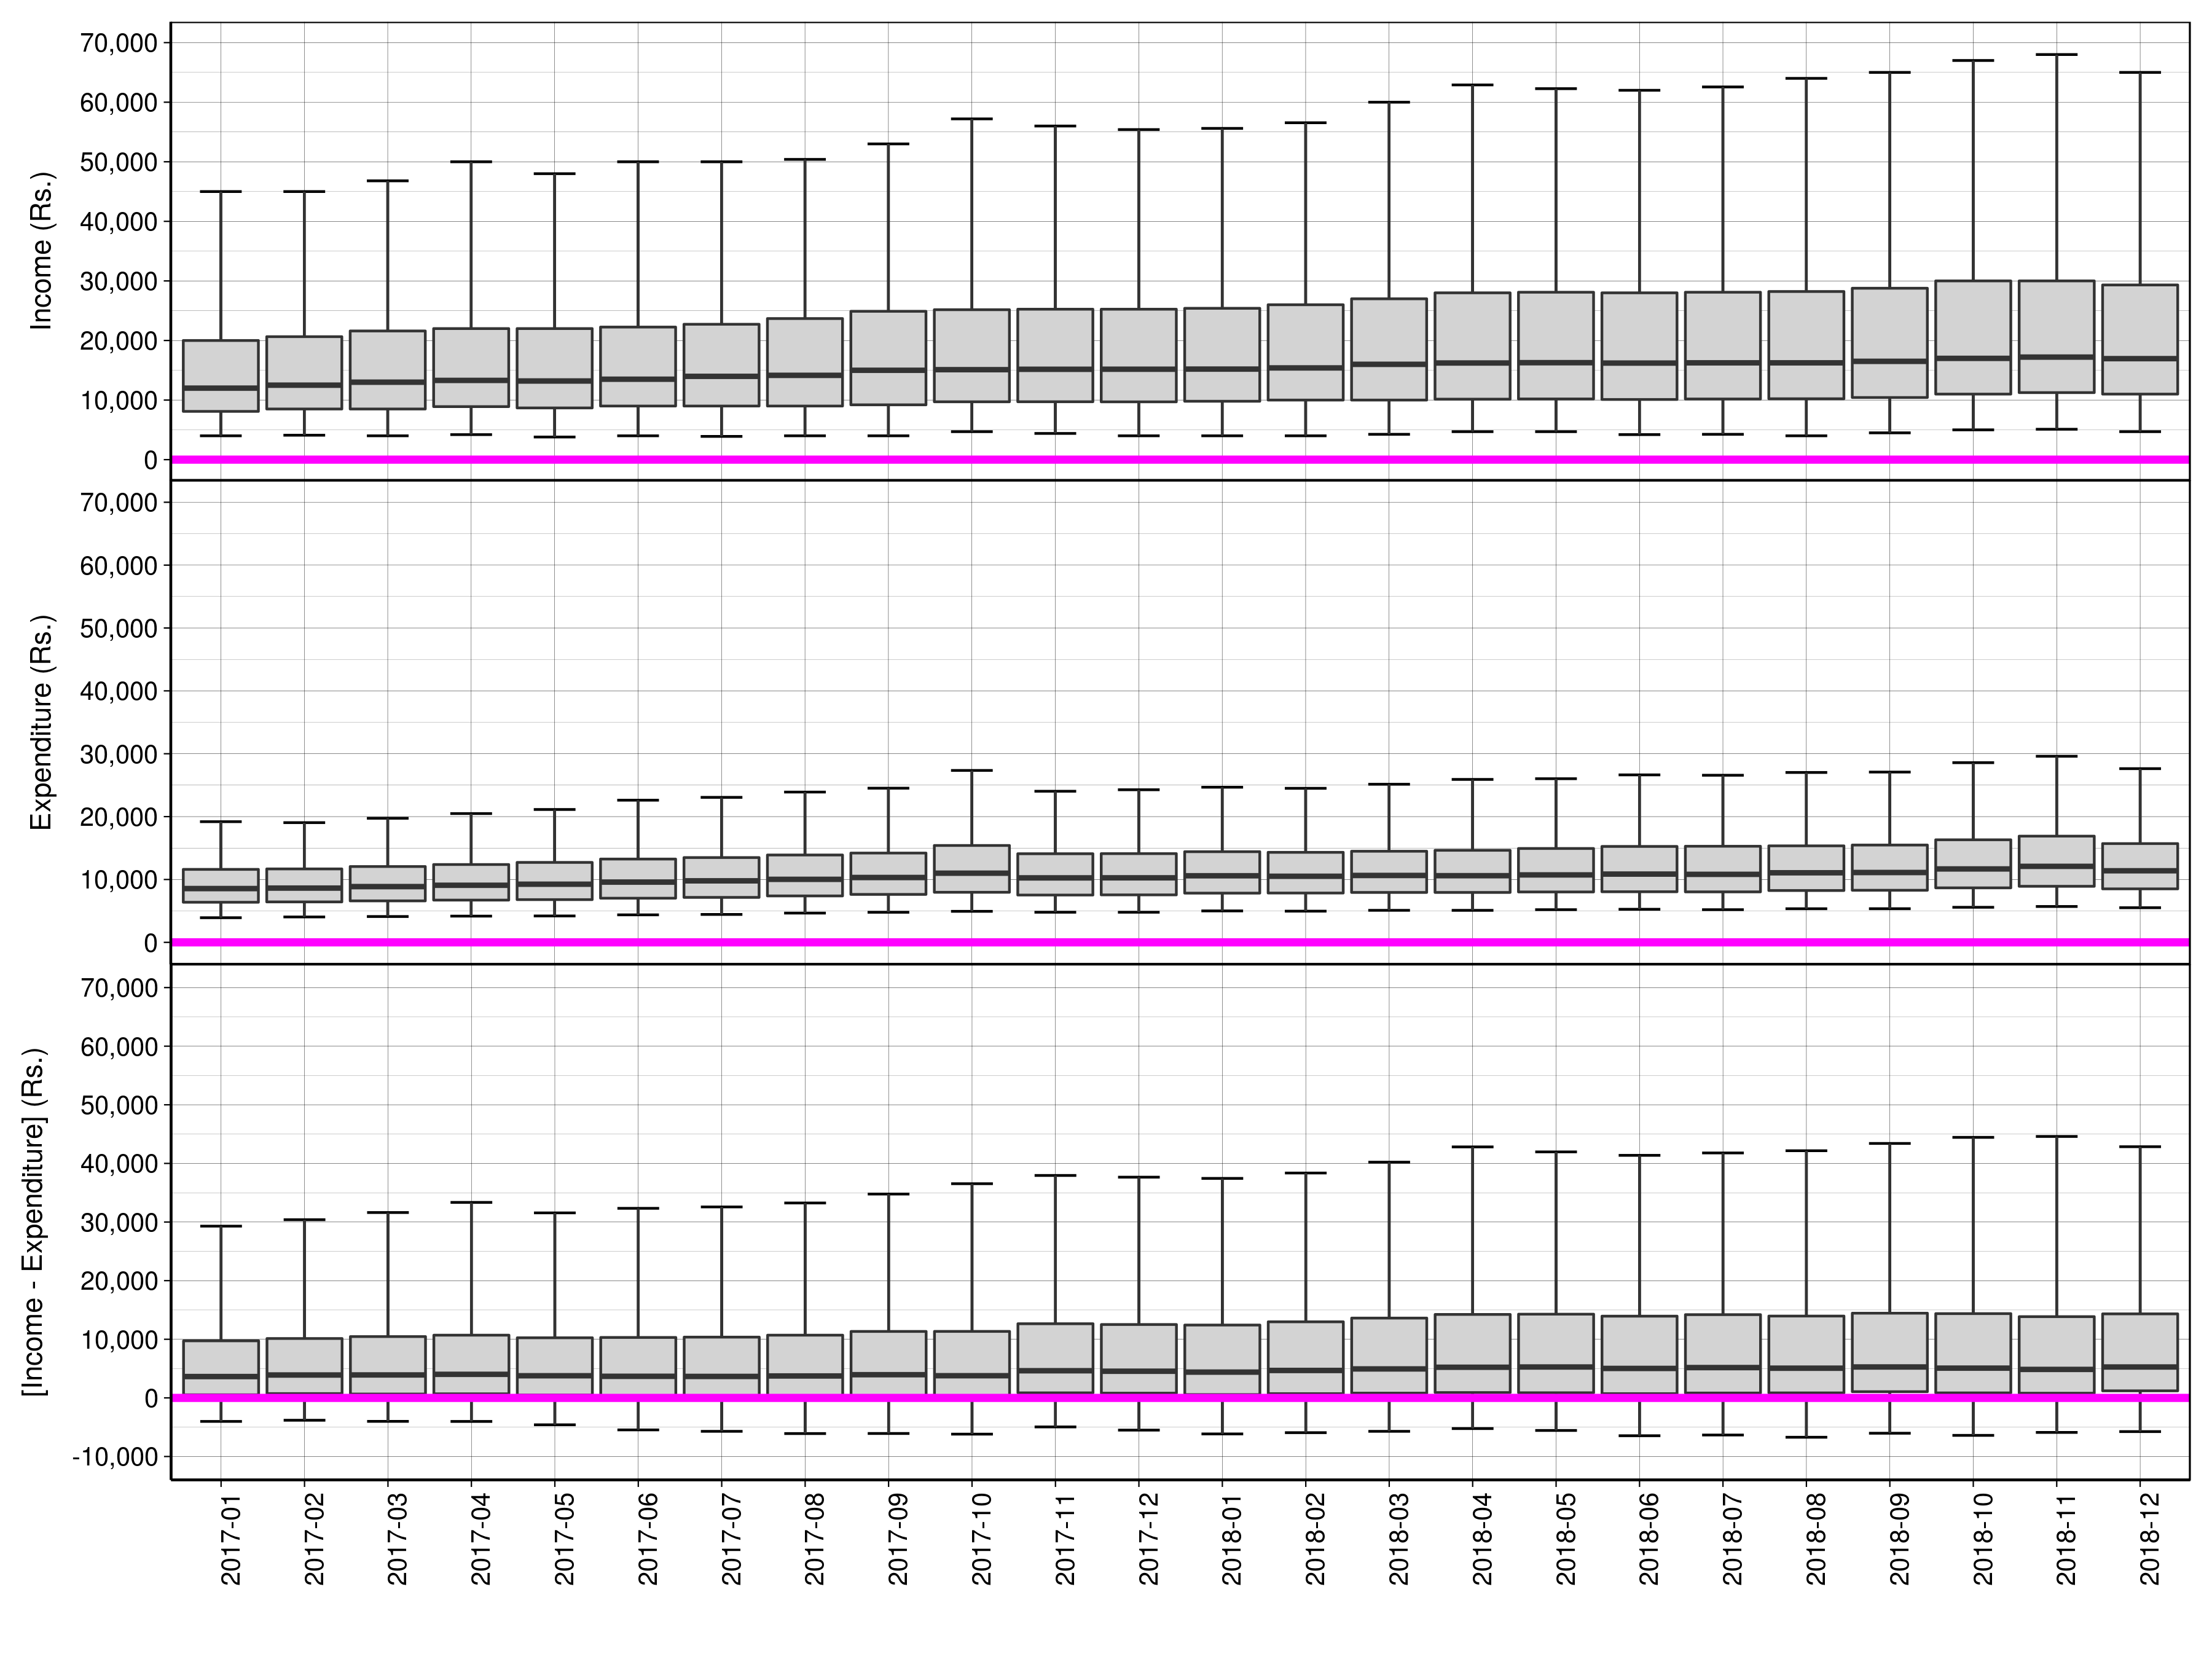
Watching Indian households: monthly distribution of income and expenditure


The graph presents the distribution of expenditure and income data across households surveyed in a given month from the Consumer Pyramids database of the Centre for Monitoring Indian Economy. The three variables in the graphs are (a) monthly income, (b) monthly expenditure and (c) the difference between the two for each household. The x-axis covers the period from January 2017 to December 2018. The distribution of each variable is presented as a box-and-whisker plot, where the box covers the range of values from the 25th to the 75th percentile while the bottom and top whiskers represent the 5th and the 95th percentile values respectively. As an example, for July 2018, the median income is Rs.16,250 (the 50th percentile point) while the box goes from monthly values of Rs.10,180 to Rs.28,100 (the 25th and the 75th percentile points). The whiskers go from monthly values of Rs.4,251 to Rs.62,559 (the 5th and the 95th percentile points).

More details about the variables can be found here.

(Content: Susan Thomas. Implementer: Geetika Palta.)


Facts for December 2018:

  • Sample size: 146,328 households
  • Income:
    • Max: Rs.1,552,200; Min: Rs.0
    • 95% value: Rs.65,000; 5% value: Rs.4,700
    • 75% value: Rs.29,320; 50% value: Rs.16,950; 25% value: Rs.11,000
    • 7,347 households lie above 95% and 7,293 below 5%.
  • Expenditure:
    • Max: Rs.1,517,686; Min: Rs.0
    • 95% value: Rs.27,631; 5% value: Rs.5,510
    • 75% value: Rs.15,710; 50% value: Rs.11,385; 25% value: Rs.8,509
    • 7,318 households lie above 95% and 7,300 below 5%.
  • [Income - Expenditure]:
    • Highest difference: Rs.1,540,150; Lowest: Rs.-1,501,786
    • 95% value: Rs.42,850; 5% value: Rs.-5,750
    • 75% value: Rs.14,333; 50% value: Rs.5,270; 25% value: Rs.1,203
    • 7,317 households lie above 95% and 7,315 below 5%.